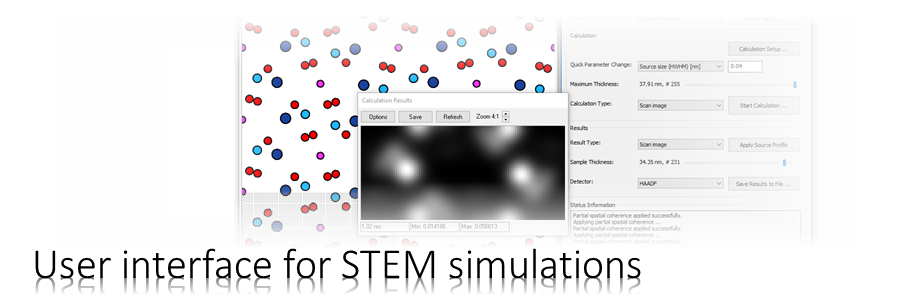
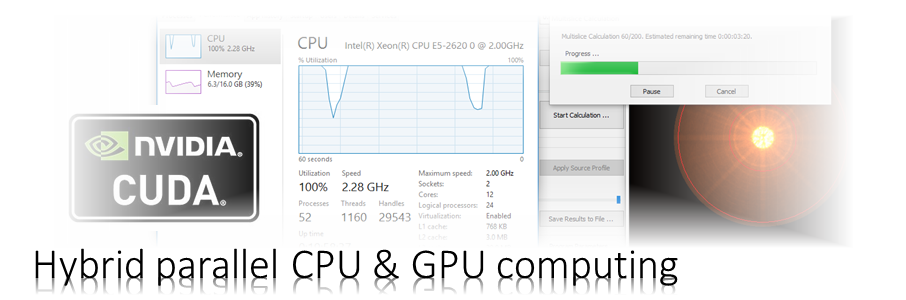
The Dr. Probe graphical user interface (GUI) provides easy access to basic STEM image simulations with direct display of results. Calculations are accelerated by using many CPU threads and your NVIDIA GPU in parallel. The software runs on 64-bit Windows operating systems.
The user interface is build in dialog form with input controls for parameter setup and managing data. Results of simulations are shown in additional data display windows.
Displays
The Dr. Probe graphical user interface displays data in separate windows. On the level of the main dialog there are two data display windows, which attach to the left border and to the right border of the main dialog when it is moved by mouse over the desktop area. The left window displays object data represented by the phase gratings currently loaded. The right window displays the calculation results currently selected. A third display window opens up with the microscope setup and is attached to its right border.
The display are for two types of data:
images, diffraction patterns, and other data maps
atomic structure models
All data display windows adjust their size automatically to the size of the displayed data. If the data is larger than a certain fraction of the screen, the window size will not be increased further, instead scroll bars are added allowing you to move the view port to each part of the data. You may also zoom the displayed images to larger or smaller sizes up to factors of 16 or 1/8, respectively. Since the result display is updated during the calculations, applying large zoom factors of this display may cause additional computations increasing the total calculation time.
The data display windows contain an [Options] button, which opens a dialog to adjust the display parameters. The [Save] button allows you to save the current display content as an image or the underlying raw data to a file.
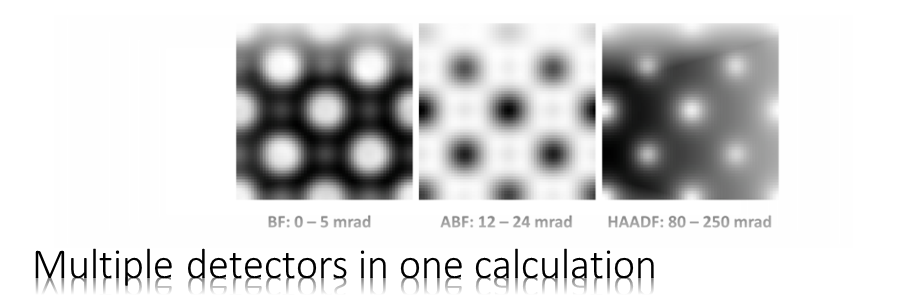
Display settings are specific to the type of data shown, i.e. you setup the display for STEM images independent from the display for CBED patterns.
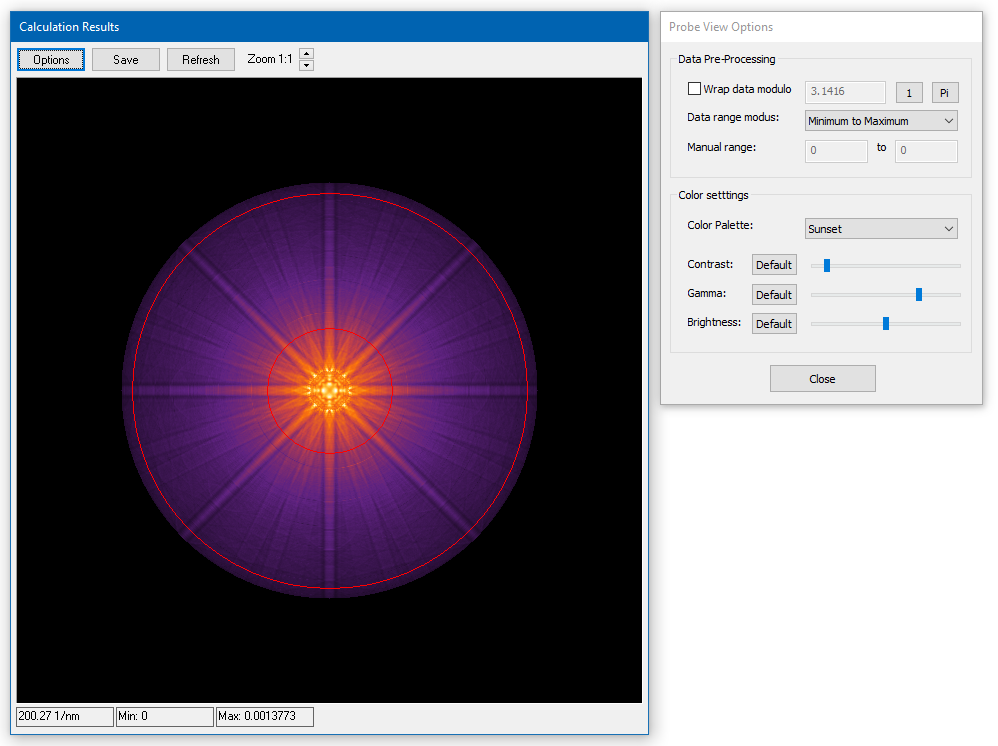
Image Displays
Image displays render image intensity distributions, diffraction patterns or other data maps as bitmaps.
General data information is presented in the status bar at the bottom. The three numbers represent (from left to right) the horizontal size of the data in nanometers, the minimum data value and the maximum data value. Values from individual data points can be seen by a tool tip when moving the mouse pointer over the image area.
Choose the way how intensities are mapped to colors from the Options dialog. The data pre-processing includes options to clip the data range translated to a color scheme or display them modulo a certain value. The color settings provide a set of color schemes (palettes) to choose from. Sliders allow you adjust contrast, gamma, and brightness of the color mapping.
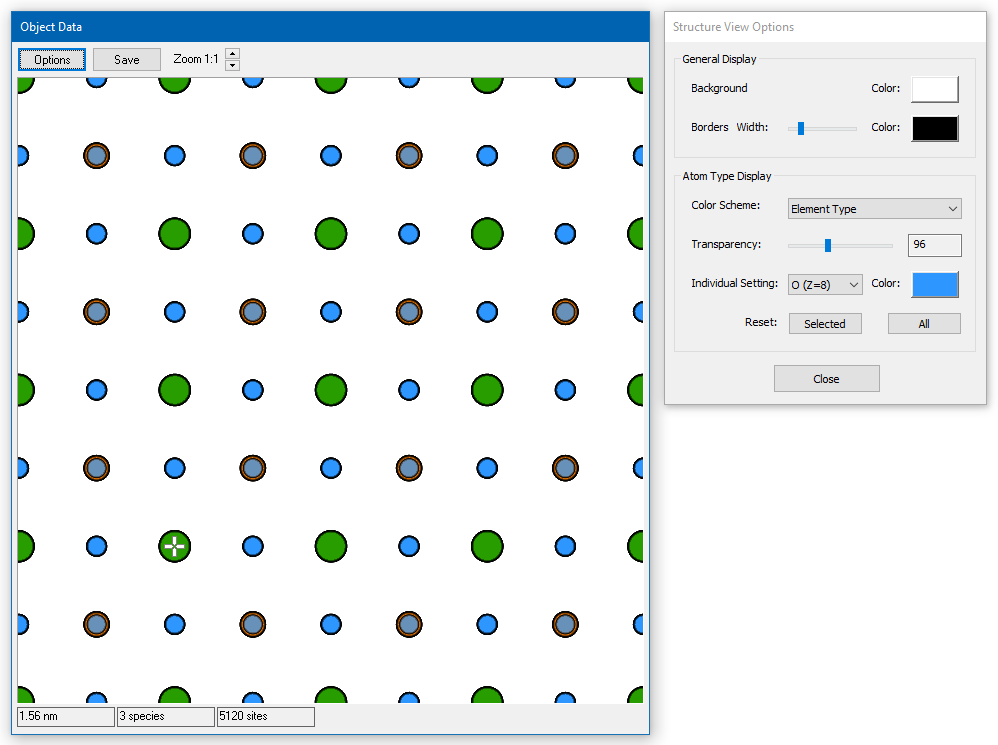
Structure Models
Structure displays render projected structure models as bitmaps.
General data information is presented in the status bar at the lower window border. The three numbers represent (from left to right) the horizontal size of the model in nanometers, the number of atom types (species) and the total number of atomic sites in the shown model. Moving the mouse over the display area will provide local structure information by a tool tip. The data refers to the composition of atoms below the pointer.
Change the appearance of the structure model by using the display options for:
– the background color
– the border width and color used for drawing atoms
– the color scheme used to distinguish different atom types
– the transparency of the filling to let atoms shine through from underneath
– individual colors used for a present atom type
The object displays of main dialog and the structure modification dialog share the same structure display options.